R Markdown
This is an R Markdown document. Markdown is a simple formatting syntax for authoring HTML, PDF, and MS Word documents. It is a great tool for statistical reproducibility. For more details on using R Markdown see http://rmarkdown.rstudio.com.
For more details, please visit the following link at Rpubs by Prashant Nair: https://rpubs.com/PNair/474584.
Correlation plot using in-built dataset ‘Cars’
A data frame with 50 observations on 2 variables.
Data source: Ezekiel, M. (1930) Methods of Correlation Analysis. Wiley.
summary(cars)
##      speed           dist
##  Min.   : 4.0   Min.   :  2.00
##  1st Qu.:12.0   1st Qu.: 26.00
##  Median :15.0   Median : 36.00
##  Mean   :15.4   Mean   : 42.98
##  3rd Qu.:19.0   3rd Qu.: 56.00
##  Max.   :25.0   Max.   :120.00
fit <- lm(dist ~ speed, data = cars)
fit
##
## Call:
## lm(formula = dist ~ speed, data = cars)
##
## Coefficients:
## (Intercept)        speed
##     -17.579        3.932
Load required libraries
library(ggplot2)
library(ggpubr)
## Loading required package: magrittr
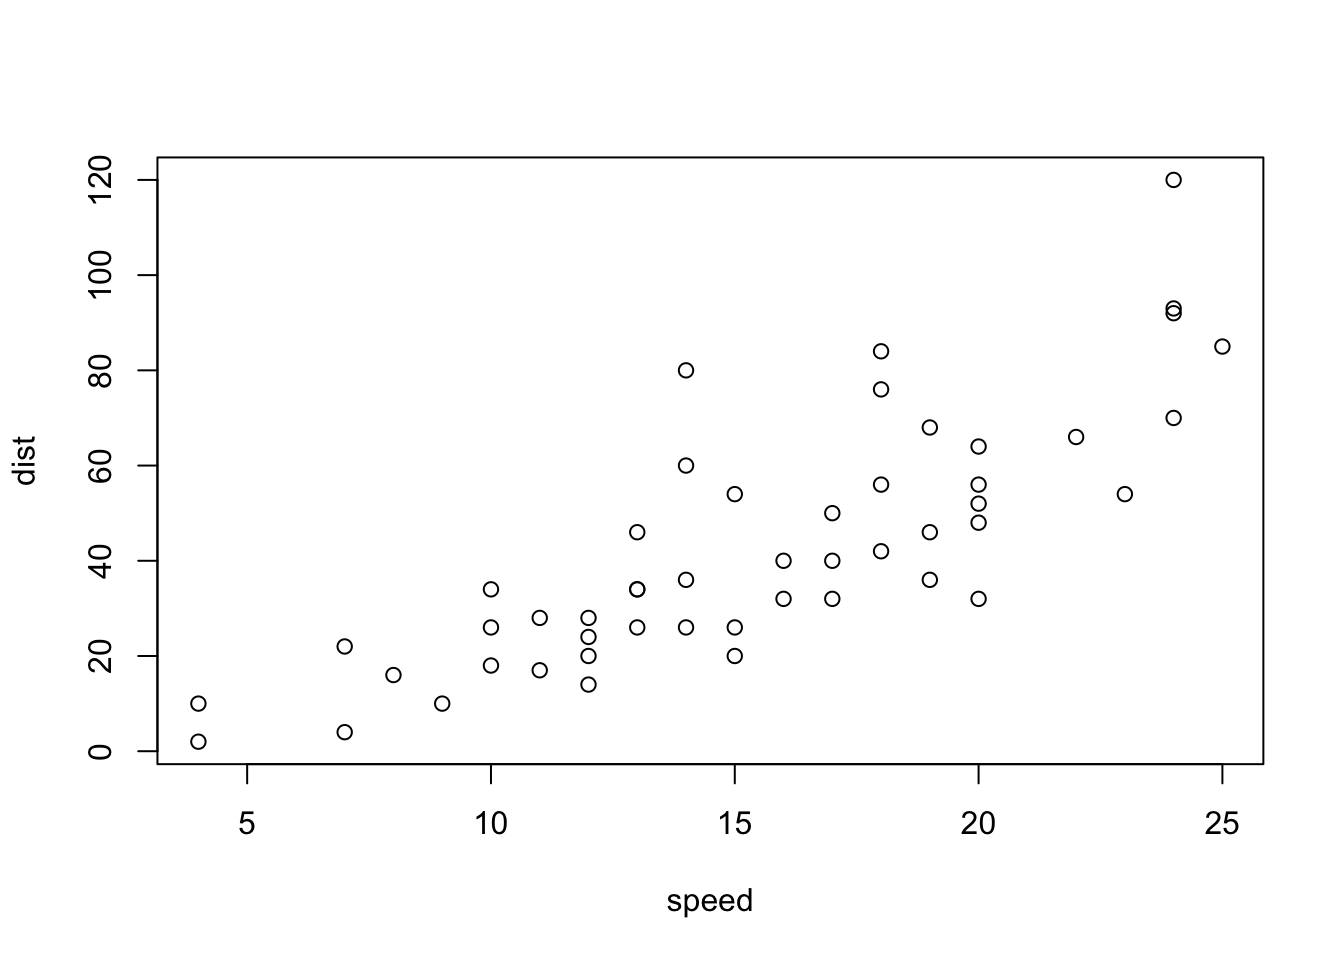
An ordinary quick plot ursing R base
See Figure 1 for example
data("cars")
data<-cars
plot(data)#basic r-plot
Figure 1: Relationship between speed and distance
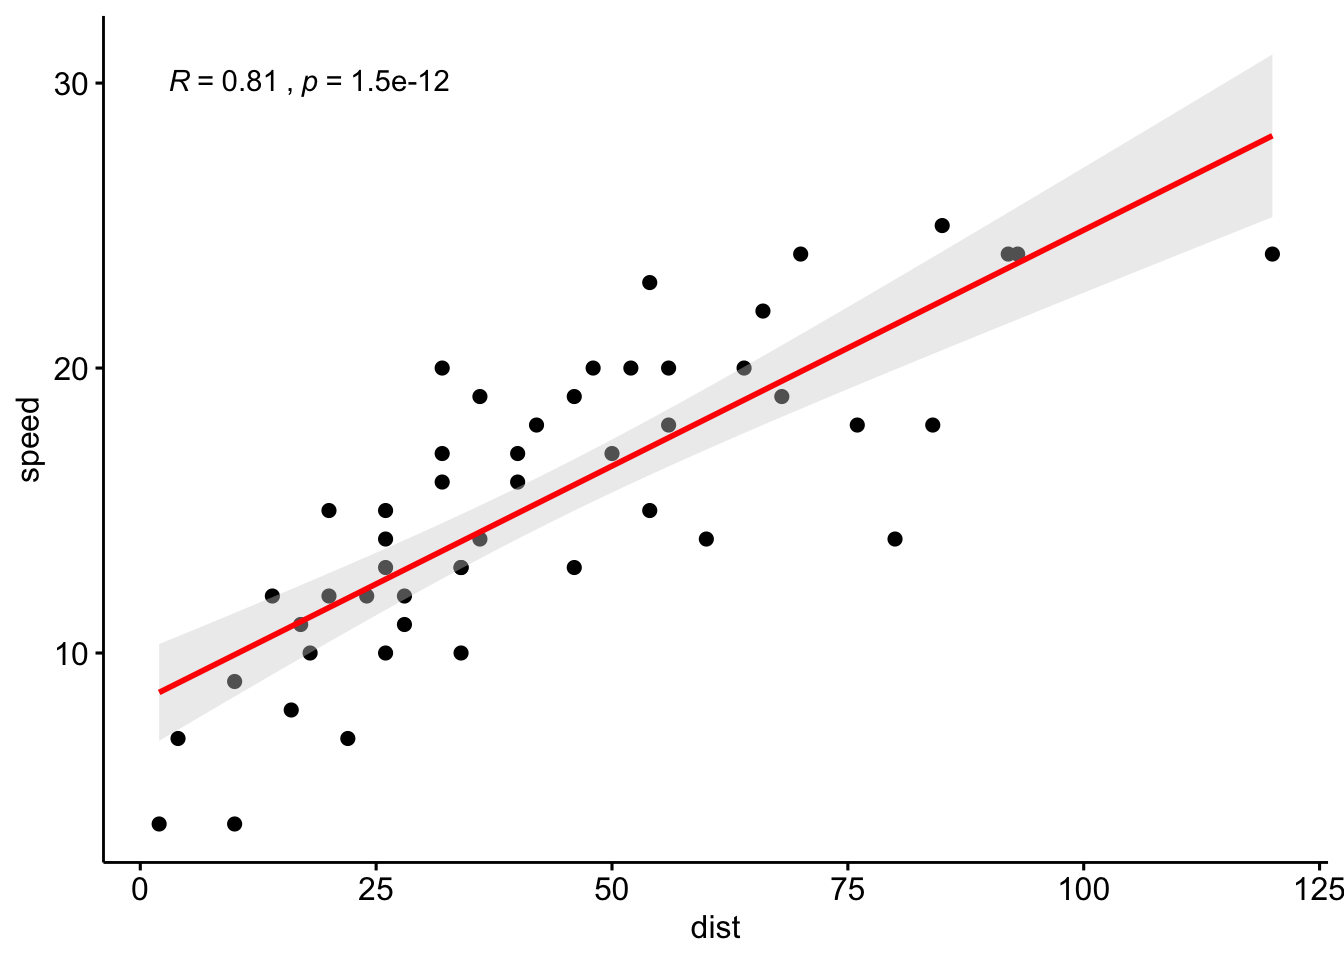
Crank the quality of the plot up
See Figure 2 for example
sp<-ggscatter(data, x = "dist", y = "speed", #mention data and axis
   add = "reg.line",  # Add regression line
   add.params = list(color = "red", fill = "lightgray"), # Customize regression line
   conf.int = TRUE # Add confidence interval
   )+ stat_cor(method = "pearson", label.x = 3, label.y = 30)# Add correlation coefficient
sp
Figure 2: Relationship between speed and distance
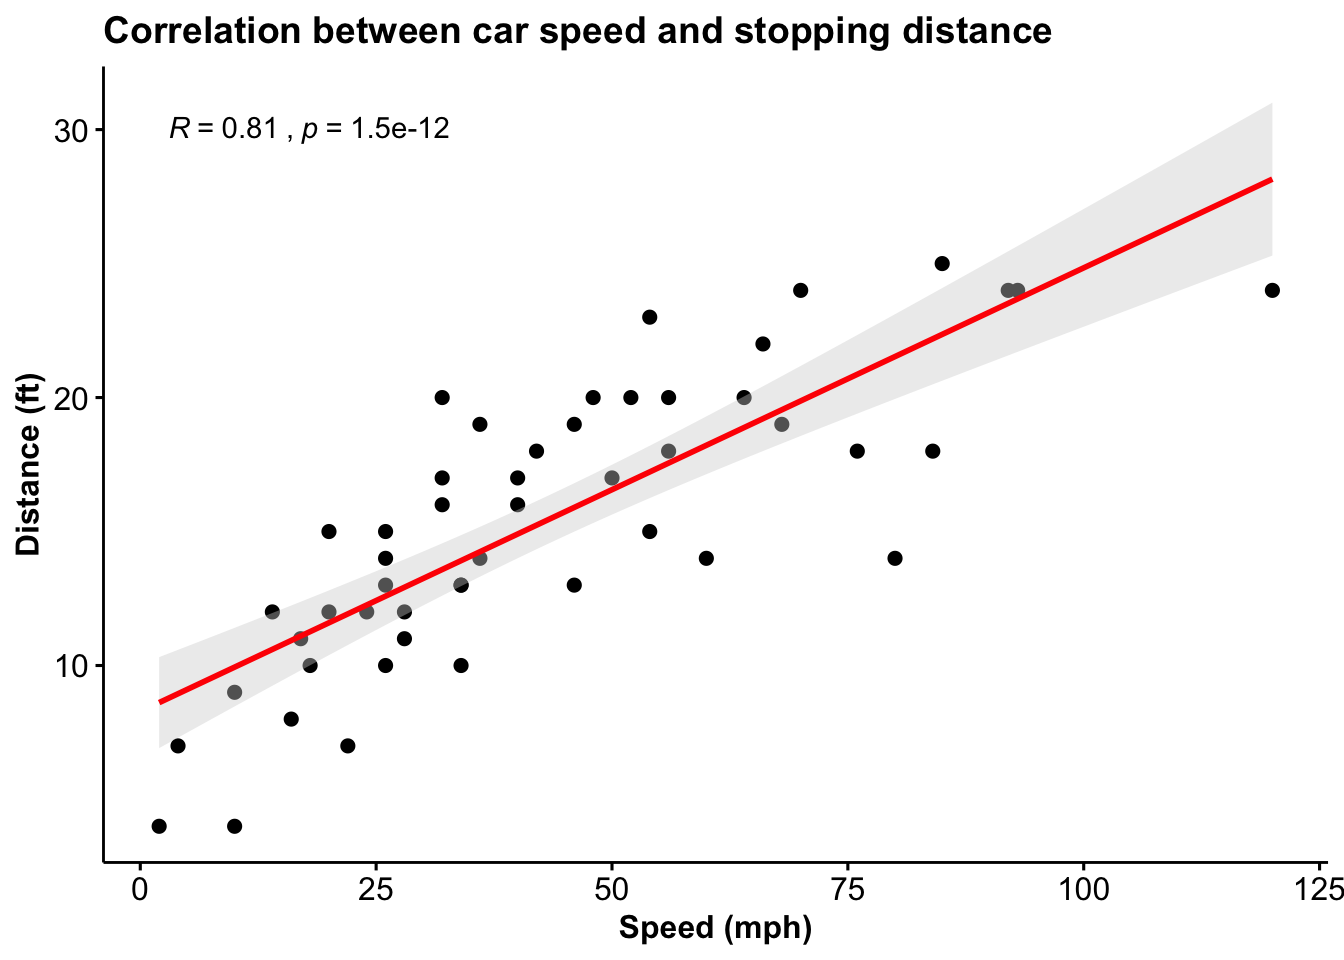
Fix the axis lables and titles
Include plots
You can also embed plots. See Figure 3 for example:
sp1<-ggpar(sp,xlab = "Speed (mph)",ylab = "Distance (ft)",main = "Correlation between car speed and stopping distance",
           font.main = c(14, "bold", "black"),
           font.x=c(12,"bold"),
           font.y = c(12,"bold"))#making font bold and beautiful
sp1
Figure 3: Correlation between car speed and stopping distance
References
Alboukadel, K. (2018). ggpubr: ‘ggplot2’ Based Publication Ready Plots. Retrieved from https://CRAN.R-project.org/package=ggpubr
H. Wickham. ggplot2: Elegant Graphics for Data Analysis. Springer-Verlag New York, 2016.